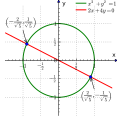
from matplotlib.pyplot import *
from numpy import *
from mpl_toolkits.axisartist import *

theta = linspace(-pi,pi,100)
x1, y1 = cos(theta), sin(theta)
x2, y2 = theta, -0.5*theta

def myAxes(this,xlim,ylim,zero=False):
	if zero:
		this.axis[:].set_visible(False)
		this.axis["x"] = ax.new_floating_axis(0,0)
		this.axis["x"].set_axisline_style("-|>")
		this.axis["y"] = ax.new_floating_axis(1,0)
		this.axis["y"].set_axisline_style("-|>")
		this.axis["y"].set_axis_direction("left")
	this.grid(True)
	this.minorticks_on()
	this.set_xlim(-xlim,xlim)
	this.set_ylim(-ylim,ylim)
	this.set_xticks([-1,-.5,.5,1])
	this.set_yticks([-1,-.5,0,.5,1])
	this.set_xticklabels([r"$-1$",r"$-\frac{1}{2}$",r"$\frac{1}{2}$",r"$1$"])
	this.set_yticklabels([r"$-1$",r"$-\frac{1}{2}$",r"$0$",r"$\frac{1}{2}$",r"$1$"])
	this.text(xlim,.1,"x")
	this.text(.1,ylim,"y")
	this.legend(frameon=False, handletextpad=0, \
		labelspacing=.05,bbox_to_anchor=(1.1,1.1))
	setp(this.get_legend().get_texts(),fontsize=12)

fig = figure(figsize=(4,4))
ax = Subplot(fig,"111",axisbg='none')
fig.add_subplot(ax)
ax.plot(x1,y1,'g',linewidth=2,label=r"$x^2+y^2=1$")
ax.plot(x2,y2,'r',linewidth=2,label=r"$2x+4y=0$")
pt1 = (-2.,1.) / sqrt(5.)
pt2 = -pt1
ax.plot([][0],pt2[0],[][1],pt2[1],'o')
ax.annotate(r"$\left(-\frac{2}{\sqrt{5}},\frac{1}{\sqrt{5}} \right)$", \
	xy=pt1, xytext=(-1.5,1),ha='left',arrowprops= \
	dict(arrowstyle="->"),fontsize='large')
ax.annotate(r"$\left(\frac{2}{\sqrt{5}},-\frac{1}{\sqrt{5}} \right)$", \
	xy=pt2, xytext=(1.5,-1),ha='right',arrowprops= \
	dict(arrowstyle="->"),fontsize='large')
myAxes(ax,1.5,1.5,zero=True)

fig.savefig("Simultaneous_equations_example_1.svg",bbox_inches="tight",\
	pad_inches=.15)


